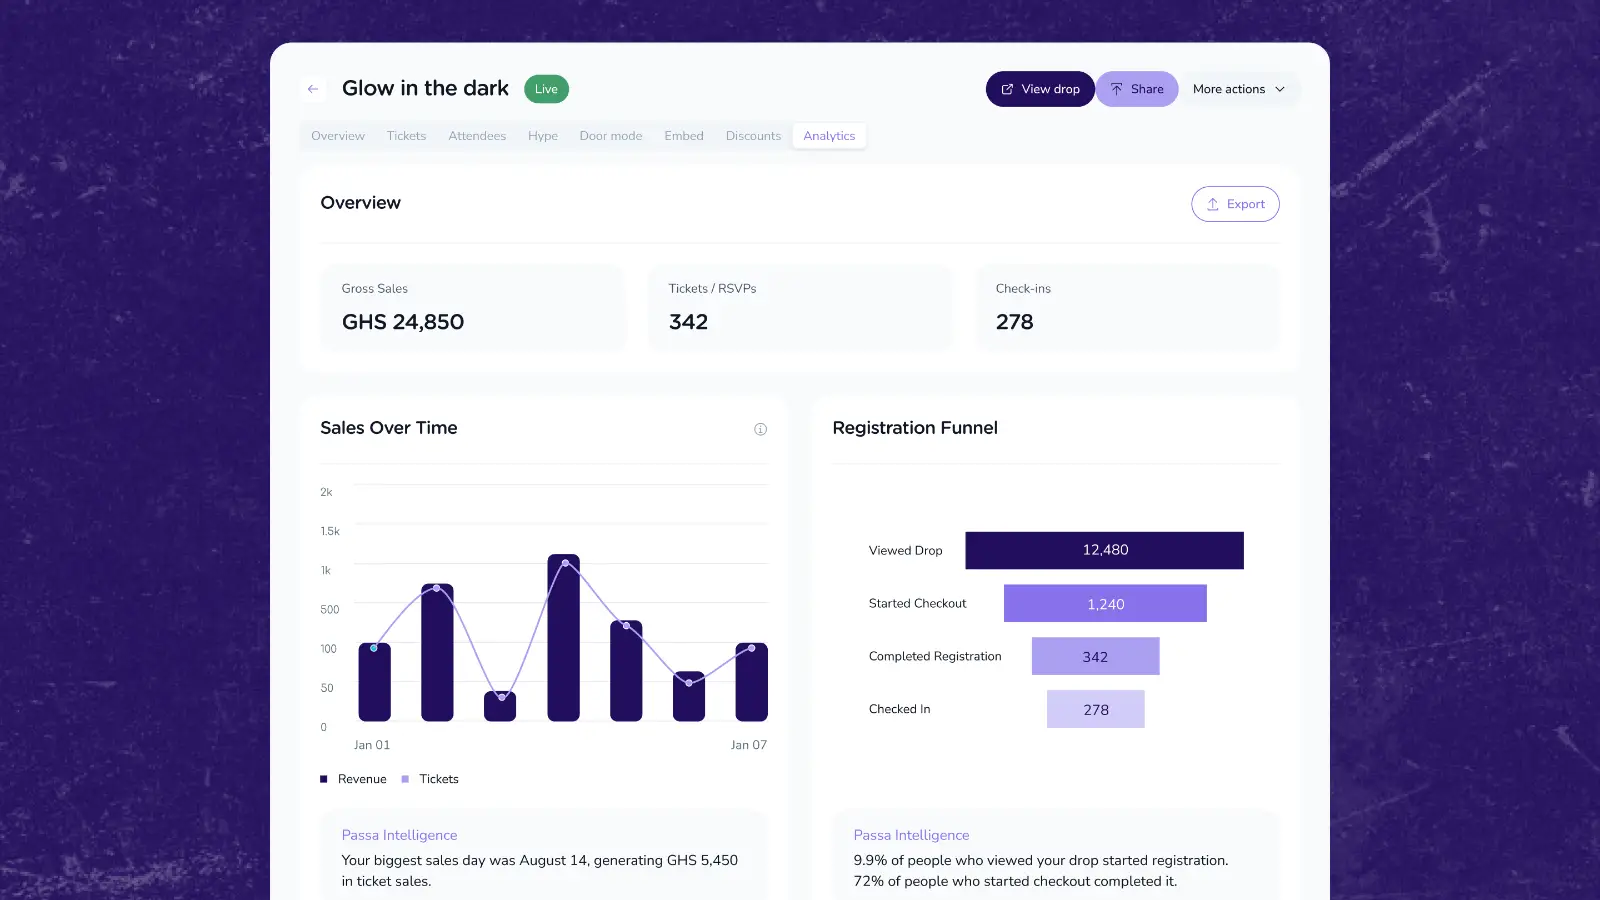
You created the drop.
You shared it.
People registered.
Tickets sold.
The event happened.
But until now, understanding what actually worked meant looking at different numbers and trying to connect the dots yourself.
Was it your promoters?
Did discounts drive most of the sales?
Were these mostly new people or returning attendees?
How many people who registered actually showed up?
Which ticket performed best?
Now, you can see it all in one place.
Meet Drop Analytics.
A new way to understand how every drop performs — from the moment someone discovers it to when they walk through the door.
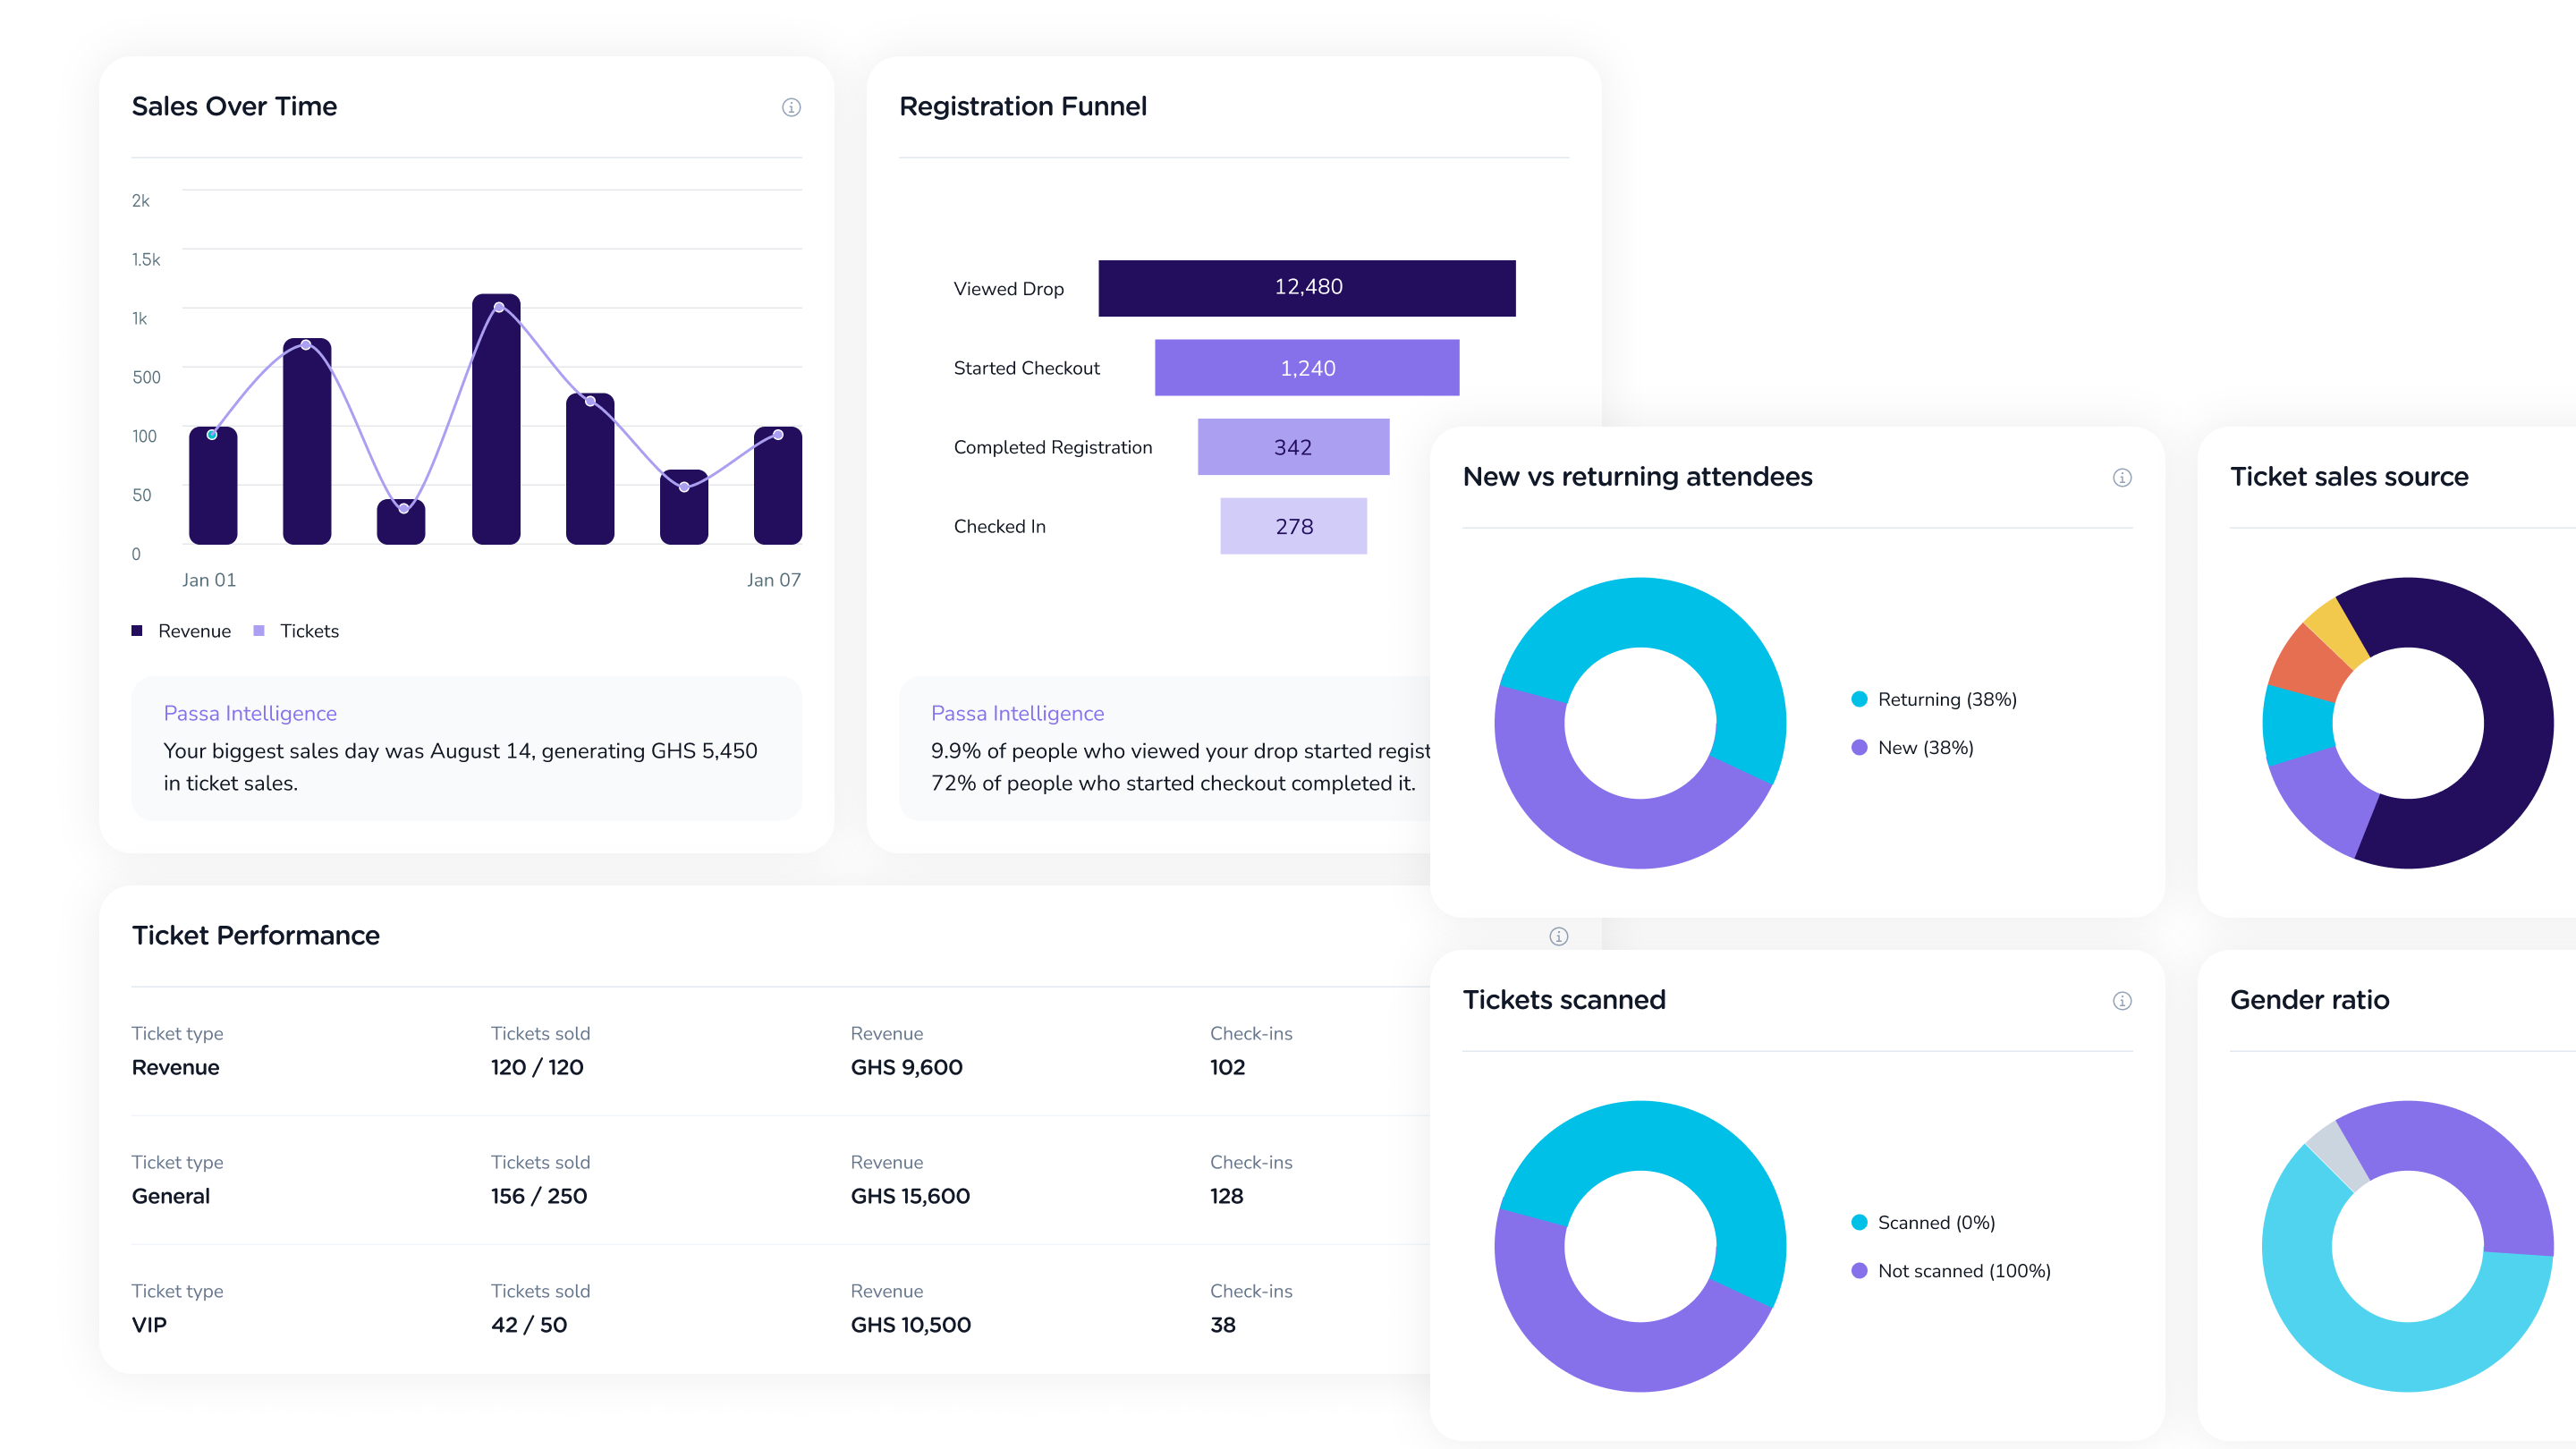
Built to help you make the next drop better
Analytics shouldn’t just be numbers on a screen.
They should help you answer:
What worked?
Who came?
Where did they come from?
Who actually showed up?
What should I do differently next time?
That’s what Drop Analytics is built for.
Every drop you create on Passa now gives you more than an event.
It gives you something to learn from.
Create. Track. Learn. Run it back.
Drop Analytics is now available in your Creator Studio.
Open any drop → Analytics to get started.